52 years in the market
Wow, I can't believe it has been two weeks since I last made a post. I'm trying to find the time - we're still spinning our wheels a bit getting the portfolio positioned.
Nonetheless, I felt that the following chart was interesting. it represents 52 years in the market - 1 year S&P 500 returns, GDP growth, the Term Premium (10 year Treasuries minus the Fed Funds rate), and S&P 500 earnings per share.
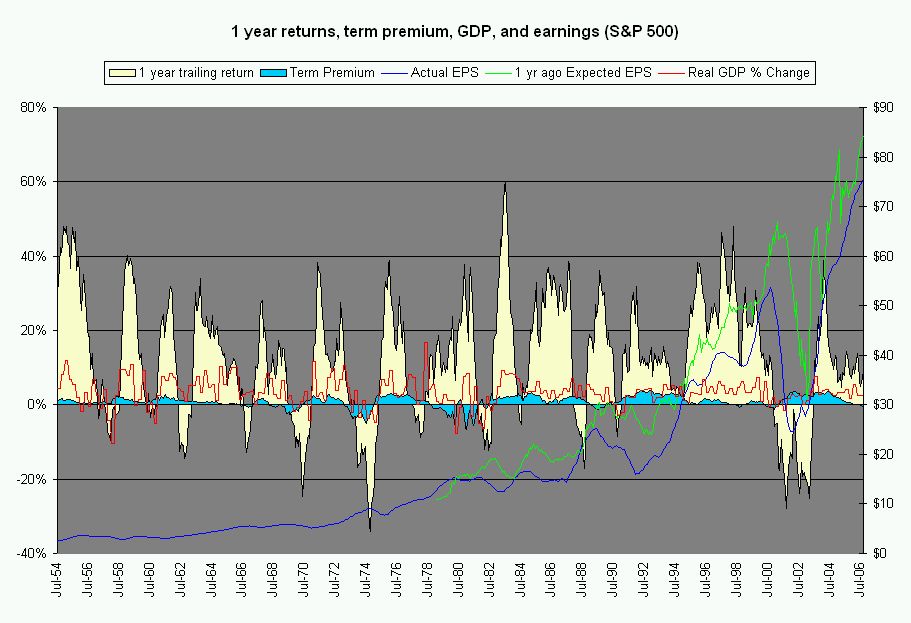
You may not believe me, but this chart represents many hours of work - scrubbing data, formatting, checking, etc. I have learned alot while doing it, though. A few important points seem to stick out:
-The Term Premium has done a wonderful job predicting lousy markets
-When real GDP growth is above 1%, the market tends to do well.
-Earnings fall quickly when the economy heads south
What you don't see here is a market valuation metric such as P/E, Forward P/E, or P/R (by Michael Alexander). I equate the over / under valuation of the S&P 500 as the amount of gasoline on the fire - whichever direction the valuation suggests the market will go eventually does happen, but the more over or undervalued the index is, the faster it occurs. That may seem very obvious, especially since we experienced this a mere 6 years ago, but it pays to remember this lesson.
posted by rvb1977 @ 10:25 PM
![]()


0 Comments:
Post a Comment
<< Home