Selling resumes
I had to sneak in a few minutes today to write. Today's small recovery at the end of the day in the indices was misleading. Many top stocks got annihilated today:
Jacobs Engineering - Down 6.7%
Fluor - Down 6.6%
Banco Bradesco - Down 4.2%
GFI Group - Down 9.3%
Ceradyne - Down 7.41%
Eagle Materials - Down 9%
...you get the picture. Leading stocks are getting beaten up.
Next I'll post some charts that show what prompted me to say that selling was likely to continue in my post yesterday.
All of these charts point to continued pressure in the short term. (Click for larger images) I guess this means I can focus on my coursework and less on looking for stocks to buy!
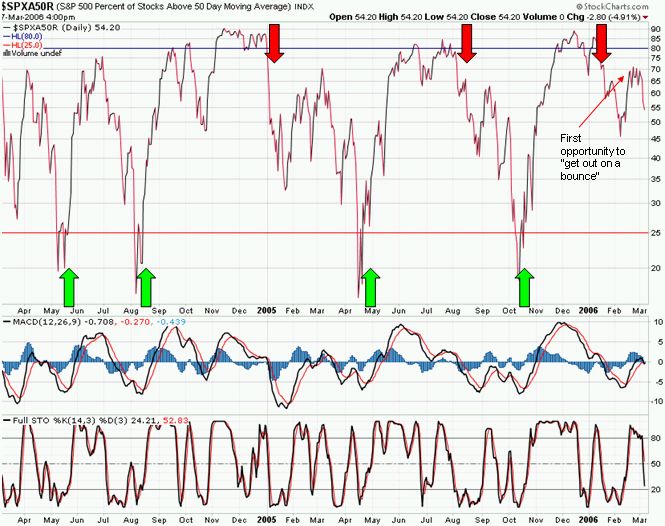
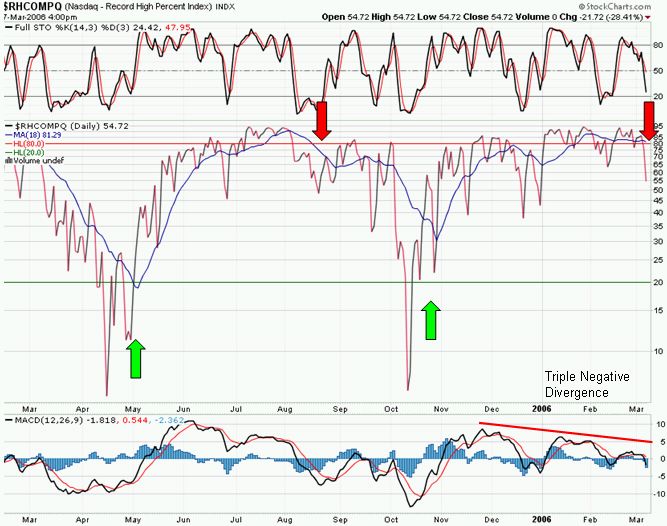
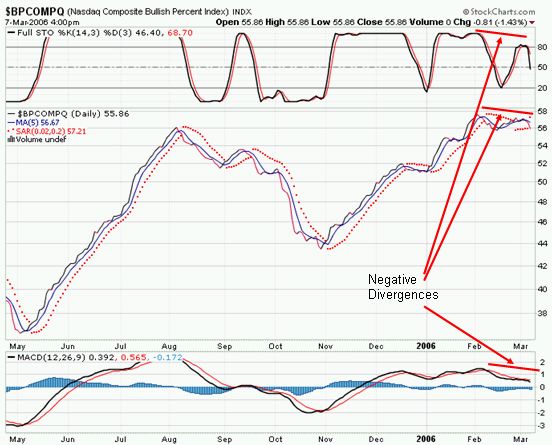
Note: you may say that the MACD is not showing divergences, it looks similar to the actual signal from the indicators. This is true. The point is that the indicator itself is diverging from the actual indices.
Now, are these charts the most important thing in the investment world? No, absolutely not. In the long run, economics prevail. These indicators can help long-term performance, however, even if all that you use them for is to avoid a big loss.
So, the underlying market action is ugly. And I just said that in the long run economics prevail. Well, we're getting some lousy economic data recently. The output gap has spiked downward (GDP growth slowing), and longer-term interest rates are again on the rise - presumably slowing down the housing market. Slow housing means a slower consumer. Is this the start of a recession? Perhaps not yet, but I see lower equity prices in the immediate future.
posted by rvb1977 @ 4:50 PM
![]()


1 Comments:
Definitely we have some negative divergences between the peaks of Jan and Mar, see
http://stockcharts.com/h-sc/ui?s=$SPX&p=D&yr=0&mn=6&dy=0&id=p86658718125&a=71301720
I hope the link comes through.
However, the chart shows a lot of support, not only the ascending supporting trendline, but also two different horizontal levels. As posted here
http://nodoodahs.blogspot.com/2006/03/predictive-model-output-mar-3-2006.html
there is support from an options perspective as well.
Nice hammer drawn yesterday, BTW.
I see limited downside at the moment, but limited upside. I could easily see a trading range of 1250-1300 until the bulls capitulate a bit more.
Good luck on your exams!
Post a Comment
<< Home