n <'--Google Analytics-->

RVB's Market Musings

What began here as an avenue to interact and learn has far exceeded those goals.

If you are a prospective employer, please consider this site a place where you can see my passion for investing...

Tuesday, August 30, 2005

Value vs. Growth

Yesterday we had our first chance to meet a program "Alum" (albeit an honorary one). He had some really neat things to say, and with 40+ years of experience, he also had a sense of humbleness to him, in that it really is true that you just don't know what a stock's price will do in the future.

Mostly my takeaway from his short talk reinforced a key belief that I have: "Value" stocks and "Growth" stocks, and the "Value vs. Growth" investing styles are not polar opposites.

I have believed that, while there are certainly some characteristics of the styles, the two are not mutually exculsive. I once read that Growth should be simply considered as an element of overall Value. I think that is wise.

What this alum did, however, was redefine "Growth" investing as "Surprise" investing, wherein "Surprise" refers to revisions in expectations. His style was very much suited to my own - cut losses quickly, and let winners run. I was surprised at that, given that he started as an investment professional in the early 60's, yet he was not an exact "value" person, in its purest definition. That's not to say that he doesn't believe in what Value investing is, or running valuation models on companies - that's important! But, in an era like the 60's, where nearly everyone who owned stock was a long term, buy, hold, and forget about the stock kind of an investor, this man certainly was not. At least, not anymore. I didn't find out if he'd changed along the way, but as we talk more, I will be sure to find out.

Monday, August 15, 2005

What I'm watching

I thought I'd put a quick blip about the potential trades I may (or may not be) making soon:

Lifepoint Hospitals (LPNT)(Short) - the company reduced guidance, fell, and then went higher a little bit after the announcment. The hospitals group looks weak to me at this point.

Apple Computer (AAPL) (Long) - My buy order actually triggered while I was away at lunch with my wonderful girlfriend on Friday!

Surmodics (SRDX) (Long swing trade) - Looking for an entry around 36.5, looking to be out around 39.

CVRD (RIO) (Long) - Ah, one of my favorite companies the past 2 years, Companhia Vale do Rio Doce (CVRD) - the world's largest iron ore producer. The company has been posting solid #'s ever since it has been publicly traded!

Ventas (VTR) (Short) - Recent weakness has made itself abundantly clear in the REITs, and I like VTR's chances to continue lower.

My Anything Goes long fund has positions in AAPL and RIO, and my Aggressive Growth Fund also has a position in AAPL.

Both of these funds have been profit taking the past week, as I believe we are headed for some intermediate term (1-6 month) weakness in the overall markets.

Saturday, August 13, 2005

Investment Mindset

Last night I was at a rehearsal dinner with some good friends when, at the table, the topic of gas prices came up (currently 2.59 or 2.69 a gallon, depending on where one lives in the local area). Gas has risen about 40% in just the past year. But, this is not happening unexpectedly, as crude oil is currently just under $67 a barrel (up from about $28 less than 2 years ago).

What was most interesting to me about the conversation was that he brought it up because it was affecting his pocket book. Now, don't get me started on "selfishness and capitalism in general because that is another 40 hours worth of discussion and many, many pages of blogs). But, the point is that he has never once thought about perhaps investing in oil, while prices continually rocket up right in front of his face. If nothing else, he could at least HEDGE his financial situation by investing as little as a hundred bucks in a good oil stock. If the price of the stock continues up, he makes money on the stock, but loses money at the pump. If the stock goes down, he loses money on the stock, but makes up for it by paying less for gas.

This is so simple, isn't it? Why then, do most Americans never make simple connections like these? Simply put, the majority have no Investment Mindset (yet they will bitch when something is affecting them)

I urge everyone to take a little bit of time and read a simple investing book or two. Start thinking about this stuff, even just a little bit, because ignorance is NOT bliss when it comes to your hard earned cash. And the "I don't have money to invest excuse" is one of the worst excuses in the entire world. Stop going to Starbucks everyday - brew your coffee at home in the morning. The 3.50 you save every day working day will become $1000 dollars at the end of the year (Starbucks addictions are almost as expensive as smoking! And, the coffee sucks, too, but because it's the trendy thing to drink, people buy it in droves because it appeals to their desire to be cool. Maybe I should write a blog on our consumption-based economy next?)

The bottom line is that everyone wants to make money - because everyone has money tied up in the markets through various plans (401k, 403b, IRA's, College 529's, the list goes on...) There's no other reason to be in the markets other than to make money. If you can find one, let me know (but you can't do it, can you?)

When you're 50 / 55 and can't retire, it will be nobody's fault but your own. Pay attention to the things around you, and think "out of the box" for a second (I hate that damn cliche but here's a spot where I think it really does work). Instead of hearing about this oil report or that new trend, take it one step further and ask yourself, "Where might the opportunities lie?"

Wednesday, August 10, 2005

The "BP's" and Oil Stocks

I wanted to share something with you that I just learned more about today on Stockcharts.com.

The "BP's" as they are called go beyond just the ones I have linked to on the right ($NYSI and $NASI). The Bullish Percentage Indices are very simple - they count up the number of stocks that are acting bullish versus the total number of stocks. Then, they divide the number to come up with a percentage. On the right, I have linked to some charts I use of the $NYSI and the $NASI.

What I learned from the stockcharts.com "Market Summary" is that there are "BP's" for a few of the sectors, as well (this is an awesome page to view daily if you are like me). So, let's look at the $BPENER, which is the oil stocks "BP". $BPENER CHART

So, what the hell am I looking at? You ask. Well, pay attention to the blue and red lines, first off. Those are the 8 and 12 day exponential moving averages. Note that it takes alot of movement - or a new trend - to get them to cross. Next, look at the fact that the actual BP line (The black one) is almost 100%. 100%! Every oil stock is going up? That's what I like to call "saturation" - and it works alot like the nasdaq bubble of 2000/2001. When EVERYONE is on the train, who is left to get on the train? Nobody. So, who is left to keep buying oil stocks to push them higher? Nobody.

This leads me to believe that oil stocks are topping. I have other reasons for believe this as well. We'll get to that in a bit.

NOTE THAT I AM NOT RECOMMENDING ONE SELLS ALL OIL-RELATED STOCKS. Tops take time - alot of it. The last oil stock top saw the oil stocks about 5 weeks in March / April of this year (and, wow, did the BP do a good job of showing it to you ahead of time).

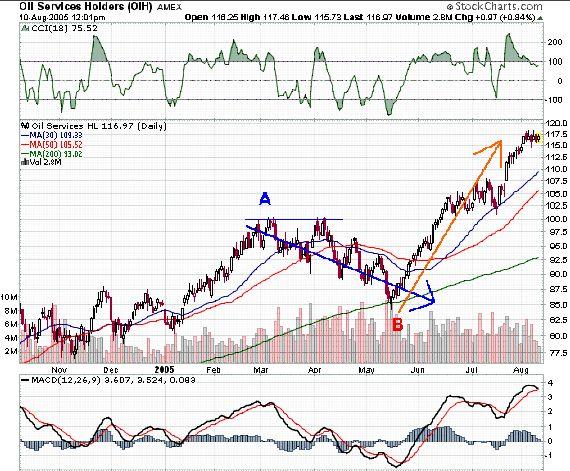
Now, let's look at the actual oil index price movement. After all, the BP chart is not a chart of oil, it is a derivative of it. And, we don't invest in the derivatives - the PRICE is what is important, right? For this, we'll look at the OIH (an oil-based Exchange traded fund)

At point A, if you kept the $BPENER chart open, you will notice that you can compare what you see on that chart to movement in the OIH. Notice how a top was forming while the $BPENER was saturating itself. Also notice how long it took for this pattern to work itself out. The original top formed in the second week of March, but, a month later the OIH returned to its March highs! Note, though that the $BPENER indicated had fallen, and, though it looked like it might have sprung higher, it did not, thus confirming the top.

Now, at point B, notice how the $BPENER has fallen so fast that it is getting to the point of saturating itself in the negative direction. Then, on the OIH, the price touches the 200 day moving average, forms a "hammer" candlestick and has rebounded ever since that point.

The $BPENER did not pick the exact bottom or top. It cannot do that. What it can do is offer some nice clues. Remember, you can't buy shares in the $BPENER, but you CAN buy shares in the OIH, or Exxon, or Chevron Texaco. My point is that price is the most important. Let's say that because of the price pattern in the OIH, we bought it near what has now proven to be a bottom at point B. When the $BPENER started to show signs that we were correct, we could have bought more. And, now would be the time where I would start looking to lighten up a little bit. Can prices go higher from here? Absolutely, and they probably will (The OIH is up over $1 today). But, picking exact tops and bottoms is impossible (and trying to do it has ruined many an investor).

So, the BP's can offer some nice clues. View the "Market Summary" page on Stokcharts.com. There are several BP's you can view!

Monday, August 08, 2005

Overall Market Under Pressure!

Overall, the market as a whole is under some serious pressure.

Some of the top stocks in the past months / year have toppled in the past few sessions. D.R. Horton (DHI), St. Joe's Company (JOE), Toll Brothers (TOL), Pulte Homes (PHM), Lennar (LEN), Builders Material Corp (BMHC), and Meritage (MTH) are all related to home builders (With exception to JOE which is more of a real-estate holding company) and each have fallen more than 5% in the past three sessions - most closer to 10%

Foreign stocks are holding up well, however. One should expect some profit taking on the mentioned stocks -> They've had HUGE runs in the past year. The catalyst has seemed to be the downgrade of TOL by Wachovia securities in reaction to their perceived lackluster earnings report last week.

I view this as a good opportunity to add the homebuilder related stocks to my watchlist. For my risk tolerance, my favorite here is probably the most boring - D.R. Horton. It is the country's largest homebuilder, and I believe they are the best run. Lennar is also interesting, and it would be my second favorite, because they are also a weak real estate play. St. Joe's has a high P/E, but is my third favorite. They own about 800,000 acres of land (some developed into condos, etc, and other undeveloped) in Florida. Baby Boomers! (Need I say more?) In the 30-34 range, DHI looks like a great play. But we just have to wait. This is a large holding in my Aggressive Growth Fund (Linked on right)

However, I would not recommend going out and buying these stocks right now. There is WAY too much risk. The markets are under pressure, not just in the short term, but we might be peaking for the year. Keep your eyes peeled.

Wednesday, August 03, 2005

Celebrate A Good Quarter

It took a while to get up and running, but my Value and Income Fund had a fairly good quarter, outperforming all 85% of all Marketocracy funds.


Rest assured, I'm gunning for #1 in the M100!

Two New Funds, and One Old Fund

I have created some new funds recently that I thought I would start to post. The key to these funds is that they don't require much work, and are research oriented.

I call the first fund my "Market Timer" fund. It's fairly simple, 70% of the fund is allocated across the market in general, and is really only there so that this big portion of the fund performs, in general, right along with the market. The other 30% is what I use to "time" the market. To do this, I use a few indicators - 4 of which are linked to on the right hand side of the page. You can view this new fund using the new market timer fund link at the right, or by clicking here.

The second fund I recently have created is a more "hands off" fund called the "Value Point Play" fund . Basically, I look for a stock that is in an uptrend (headed upwards, making higher lows and higher highs) on a weekly chart. If it has pulled back to its 26-Week Exponential Moving Average, AND looks like on its daily chart that it has bottomed at that point, I take an 8% (of the fund) position in the stock. If not, I wait until it does look to me as though it has bottomed, OR I wait for the stock to pull back to the 52-Week Exponential moving average. The description for this fund that I have given is "This fund purchases stocks that are in uptrends on weekly charts, but have pulled back to either their 26 Week Exponential Moving Average, or their 52 Week Exponential Moving Average. The fund uses daily charts for entry. The theory is that there is a lower amount of short to intermediate term risk in stocks that have pulled back in two ways: 1) "Bad" news is likely expected or already priced into the stock and 2) They are still in general uptrends, but have pulled back, so general market volatility is less likely to have an effect on these stocks Each position is entered as 8% of the fund, and cut in half when the stock reaches its old high, if such an event occurs. You can view the fund's public page by clicking here.

Here is an example of a purchase I made in the Value Point Play fund this morning, Boyd Casino. Note that the RED line on the Weekly chart of BYD represents the 26 Week Exponential Moving Average. You can see on the daily chart of BYD that the stock is basing inside a wedge, with support at $51.

BYD Weekly:


BYD Daily:


Finally, I am going to link my blog to my oldest fund. This fund is just called an aggressive growth fund, but the reality is, I let myself do whatever I want in this fund (to an extent, because I can only BUY stocks in the fund). I need to come up with some kind of cool, sexy name for it. So, I'll let anyone who reads my blog to make a suggestion as to what it should be! You can view this fund's public page here. Oddly, this fund has performed very well, mostly because of Google, and Valero Energy (I no longer hold VLO in the fund, however - those shares were sold at $82).

So there you have it. Two new funds, and one old one!

Monday, August 01, 2005

Where am I?

Now that I am no longer gainfully employed, I am spending my days in front of the computer, piloting my future business plan - to some extent. I am running a trading business, or "mocking" it, rather.

The first week of my business saw one horrible trade on Panera bread (PNRA)lose about 1.2% of my company's equity. That was day three. It's always good to get a reminder that this business is perhaps the single hardest thing one can do professionally (physical things like pro football aside).

The good news is that my business, on paper, finished down a mere 0.04% down for the week. So, were it not for my lousy trade, it would have been up 1.2%.

Either way, those numbers are still "noise".

As I stand at this very moment, I have four positions, and all of them are SHORT (click for definition) - as I believe the market's rally has reached a hiccup spot, at least temporarily.